


Table of contents
Zabbix is an open-source monitoring software tool used for monitoring diverse IT components, including networks, servers, virtual machines, and cloud services. It's designed to provide real-time insights into the performance and availability of various components in your infrastructure.
monitoring internet speed and Quality is one of the important things that Companies need. in this Article, we want to describe how we can monitor internet speed using Zabbix.
In this Article , I use Centos Version 8 and Zabbix 6.4.10.
Install dependencies
first, we need to install dependencies.
dependencies Contain git, curl, wget, Zabbix agent2 and speedtest
yum update
yum install git -y

rpm -Uvh https://repo.zabbix.com/zabbix/6.4/rhel/8/x86_64/zabbix-release-6.4-1.el8.noarch.rpm
dnf clean all
dnf install zabbix-agent2 zabbix-agent2-plugin-* -y
yum install zabbix-sender -y

curl -s https://packagecloud.io/install/repositories/ookla/speedtest-cli/script.rpm.sh | sudo bash
yum install speedtest -y
open /etc/zabbix/zabbix_agent2.conf file with nano and add your Zabbix IP and your server Hostname for add to Zabbix
Server=YOUR_ZABBIX_IP
ServerActive=YOUR_ZABBIX_IP
Hostname=YOUR_SERVER_NAME
after that restart Zabbix Agent2
systemctl restart zabbix-agent2
systemctl enable zabbix-agent2
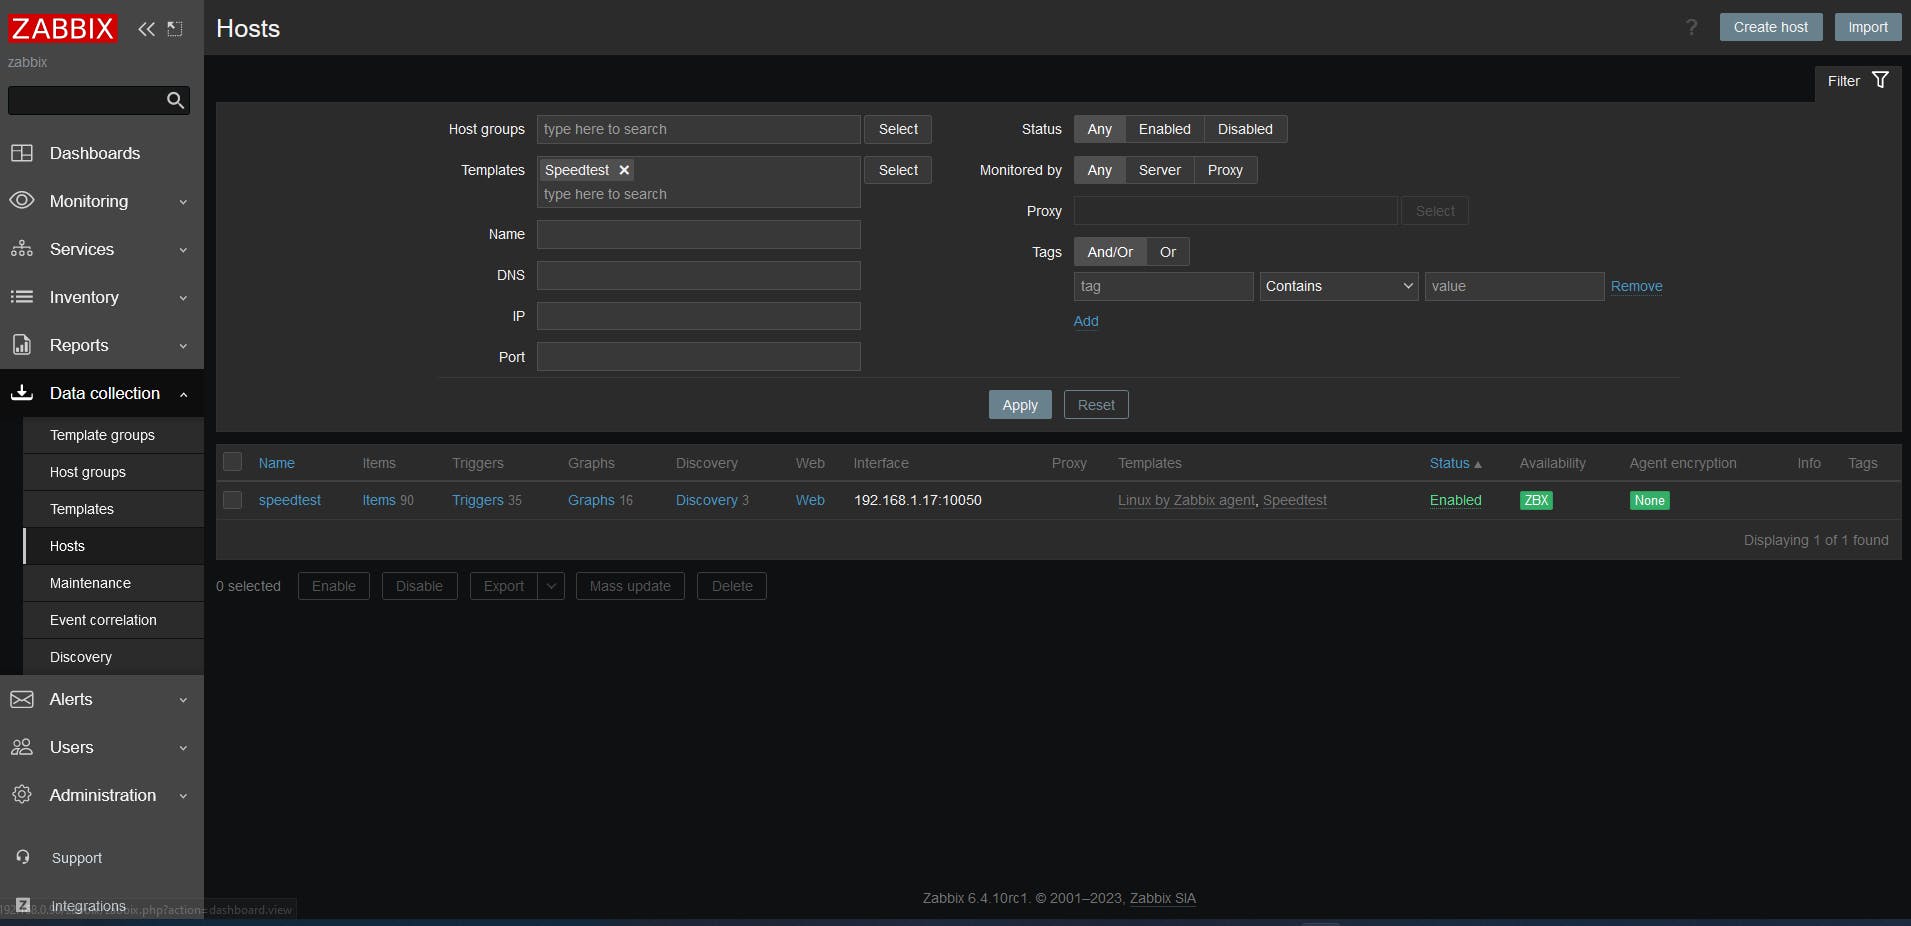
Now you can add your server to your Zabbix Server
Clone the git Repository
then, clone the GitHub repository with the blow Command.
git clone https://github.com/soloranger/zabbix-internet-Speedtest-Template.git
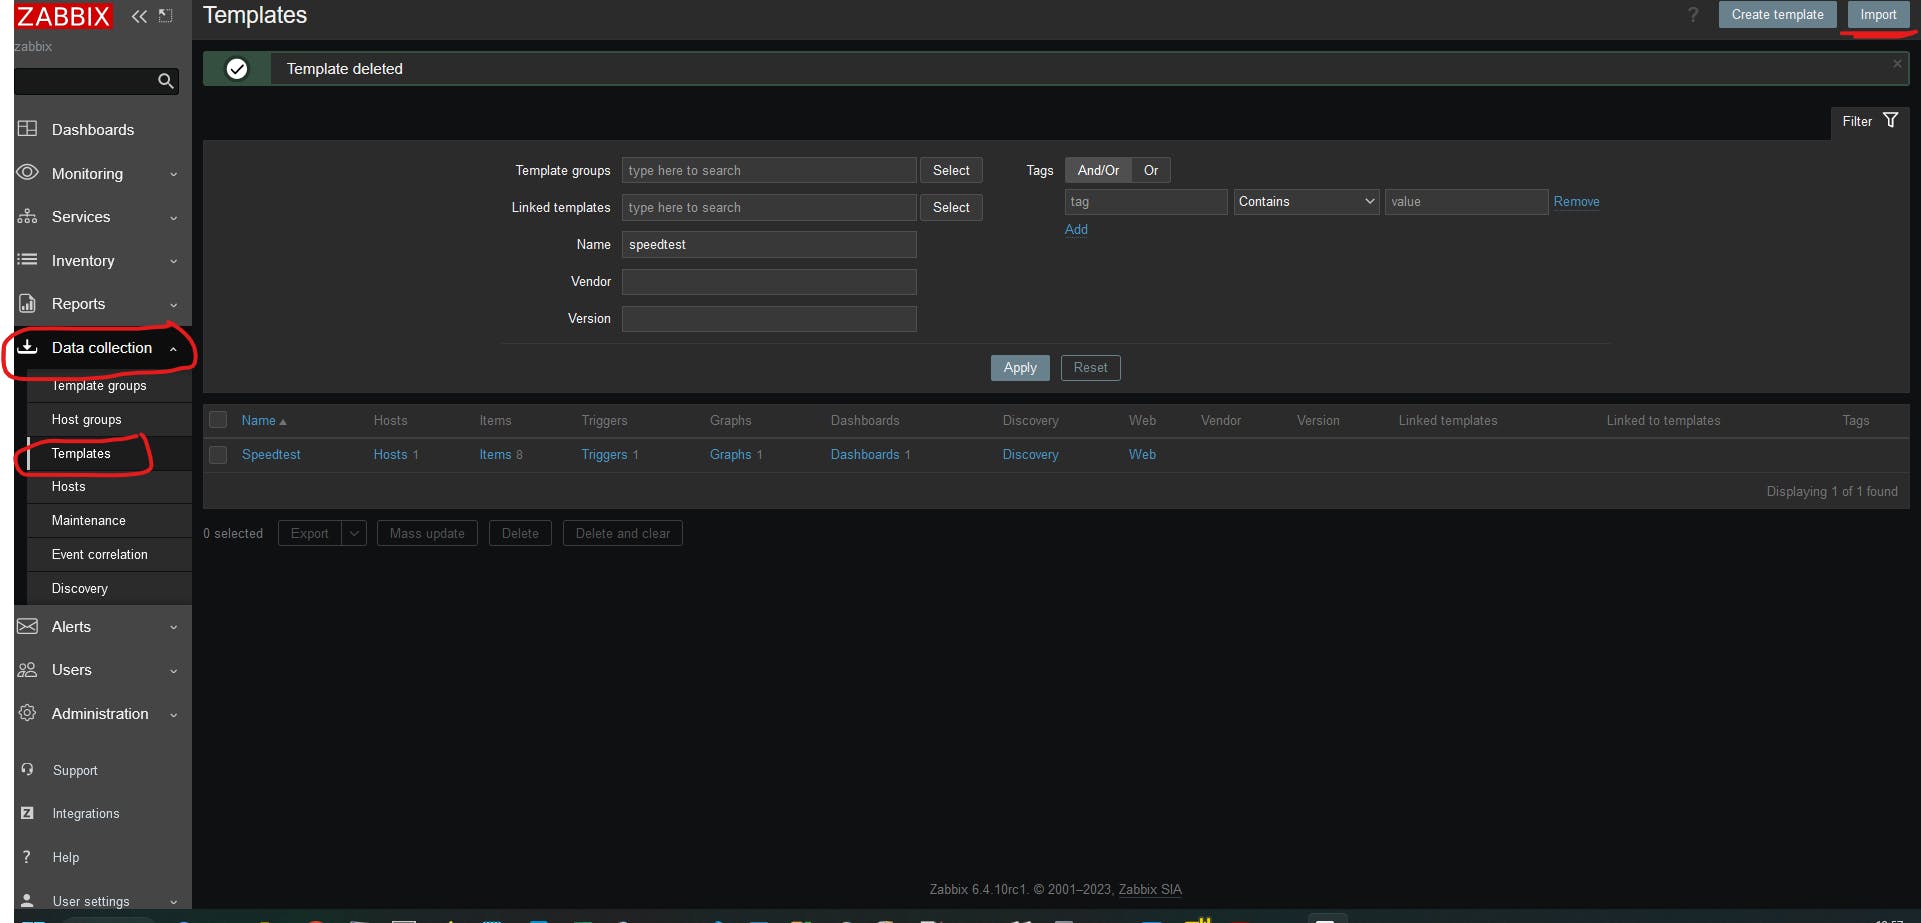
cd to Directory and add Speedtest_Template.xml Zabbix Template from Data Collection > Templates > import
cd to Code Directory and run speedtest.sh with -s argument. -s argument for the server ID that you want to use for the speed test.
chmod +x speedtest.sh
./speedtest -s 58210
after a few seconds, You can see Zabbix_Sender, Send data to Zabbix
Grafana Dashboard
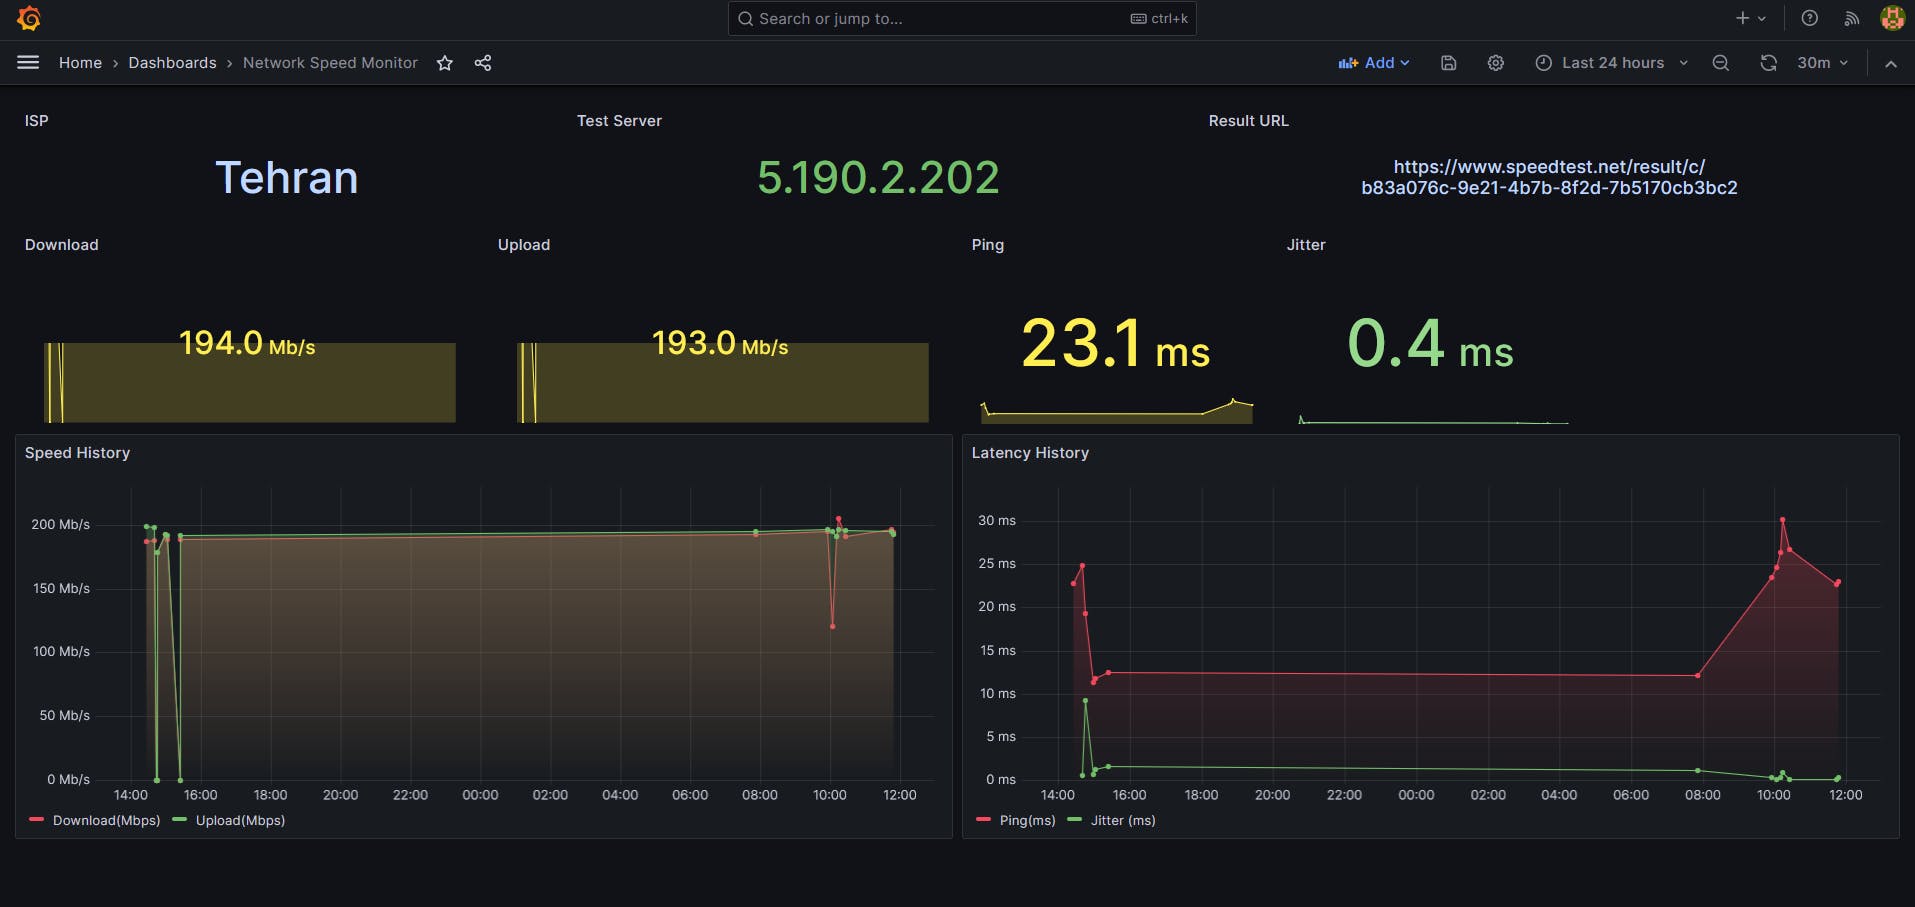
It's time to see the output in a beautiful dashboard in Grafana :D
open Grafana -> Click + icon -> select import dashboard -> select Config.json file from Git Repository
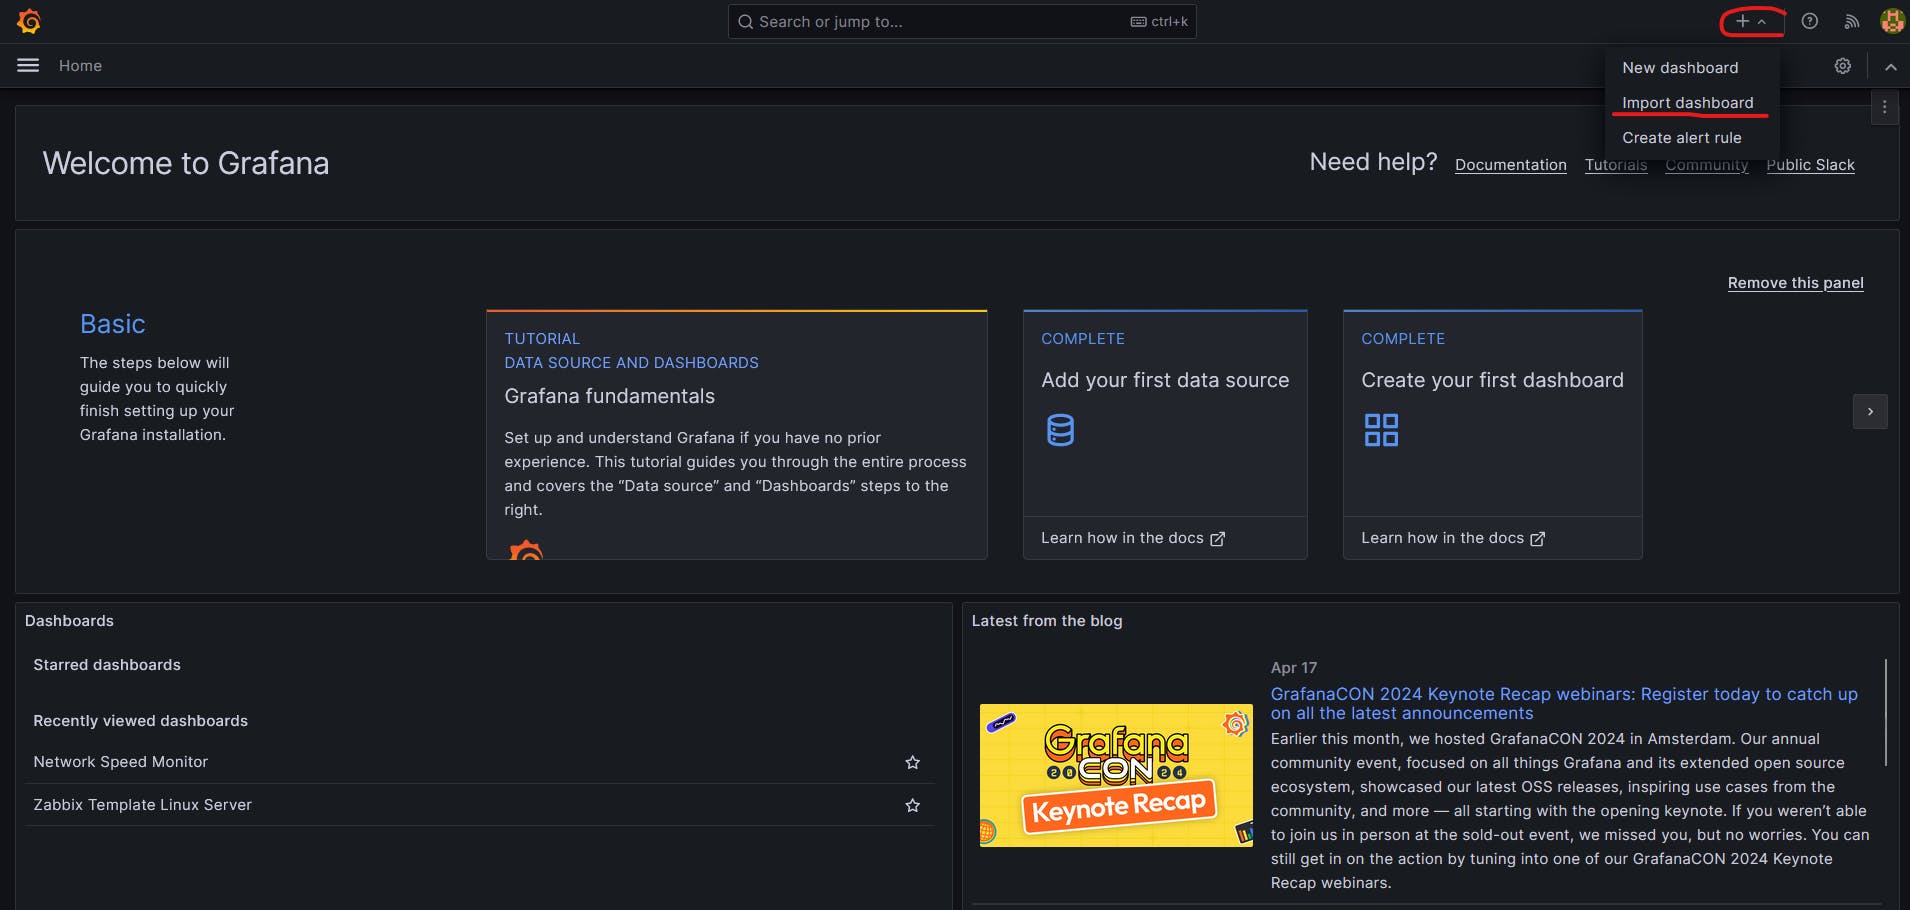
Notice: You should Connect your Zabbix to your Grafana.
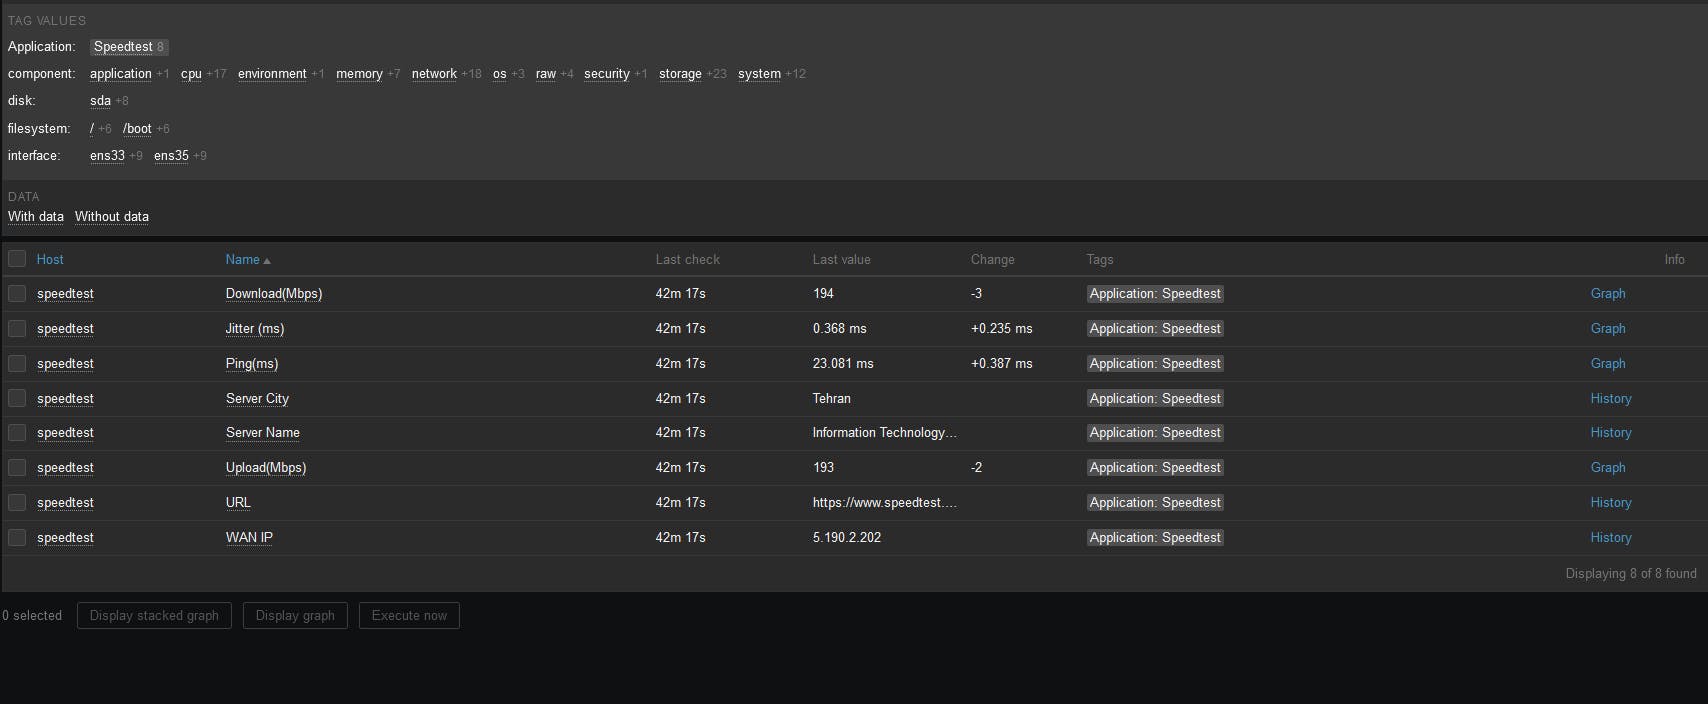
after added, you can see your dashboard with this Data :)